As global temperatures climb toward a 1.5°C threshold, the fiscal levers of green tax incentives are proving indispensable for accelerating the net-zero transition. In 2025, with carbon pricing revenues surpassing $100 billion annually, these mechanisms are not just environmental safeguards but strategic imperatives for businesses seeking resilient growth. Carbon credits, offering verifiable emission offsets, and subsidies like investment tax credits (ITCs) are unlocking $1.2 trillion in projected U.S. clean energy investments alone through 2034, while fostering innovation in renewables and carbon capture. For multinational enterprises, this represents a dual opportunity: slashing compliance costs by 15-25% through offsets and reclaiming up to 30% of project expenses via targeted credits.
This article unpacks 2025’s global green tax landscape, from EU decarbonization grants to Asia-Pacific hydrogen subsidies, equipping executives with a roadmap to leverage carbon credits and subsidies amid evolving regulations like the EU’s Clean Industrial Deal. In a year where 80 carbon pricing instruments cover 28% of emissions, proactive adoption can yield 20% ROI on sustainable projects while mitigating risks from fossil fuel subsidy phase-outs.
The Global Green Tax Ecosystem: From Pricing to Credits
Green tax incentives encompass a spectrum of tools: direct subsidies (e.g., grants for R&D), tax credits (deductible against liabilities), and carbon credits (tradeable offsets under frameworks like Article 6 of the Paris Agreement). By 2025, 75+ jurisdictions operate these, generating revenues reinvested in climate programs – over 50% of $100 billion+ flows fund nature-based solutions and infrastructure. Carbon pricing, via taxes or emissions trading systems (ETS), dominates, with ETS revenues leading at $60 billion in 2024, projected to hit $70 billion in 2025 amid EU ETS expansions.
Key mechanisms include:
-
-
- Carbon Credits: Verifiable reductions or removals (e.g., via reforestation or direct air capture) traded on voluntary or compliance markets. Prices for nature-based credits averaged $15-20/tCO₂e in 2024, with premiums for high-integrity removals reaching $50/tCO₂e; 2025 forecasts a 10-15% uptick driven by corporate net-zero pledges.
- Subsidies and Credits: Accelerated depreciation, ITCs, and production tax credits (PTCs) reduce effective costs. Globally, these reward 2.6% of corporate tax incentives for green sectors, though polluting subsidies persist at 9.5%, a gap policymakers are closing.
-
The table below highlights top incentives across leading jurisdictions, focusing on accessibility for SMEs and multinationals.
|
Jurisdiction |
Key Incentive | Details |
Projected 2025 Benefit |
|
United States |
IRA ITC/PTC | 30% credit on solar/wind/geothermal; $85/tCO₂ for sequestration (up from $50); extends to 2032 with wage requirements. | $300B in investments; 10% avg. ROI boost. |
| European Union | Clean Industrial Deal Grants | Accelerated depreciation for clean tech; €0.22/kg CO₂ tax on imports via CBAM; R&D deductions up to 100%. |
€50B revenue for green funds; 20% cost savings on EV batteries. |
|
Canada |
Carbon Pricing Rebates | $65/tCO₂ tax with industrial offsets; subsidies for clean hydrogen ($0.60/kg credit). | $10B in credits; 15% emission cuts in heavy industry. |
| China | Green Innovation Fund | Subsidies for EVs/heat pumps; carbon credits via national ETS (covers 40% emissions). |
$72B package; 25% growth in solar credits. |
|
India |
GST Exemptions on Renewables | 5% GST on solar modules; carbon credit trading under new framework. | $15B in offsets; 30% subsidy on green hydrogen. |
| South Korea | Battery Manufacturing Credits | 10% ITC on EV batteries; phased EV purchase exemptions. |
$20B in R&D grants; 40% margin uplift for exporters. |
These tools not only internalize externalities but catalyze supply chains: U.S. IRA credits have spurred $100 billion in battery investments, while EU subsidies align with Horizon Europe’s €95.5 billion R&D envelope.
Spotlight: Carbon Credits as a Revenue Engine
Carbon credits bridge compliance and innovation, enabling firms to monetize reductions. In 2025, voluntary markets issued 305 million tCO₂e, with retirements at 180 million – stagnant but poised for growth via CCP standards. Compliance markets, like California’s cap-and-trade ($5B revenue), offer stability, with prices at $25-30/tCO₂e. Businesses can generate credits from projects like afforestation (yielding 5-10 tCO₂e/hectare annually) or CCS ($85/tCO₂ under U.S. 45Q), trading them for cash flows up to 20% of project costs.
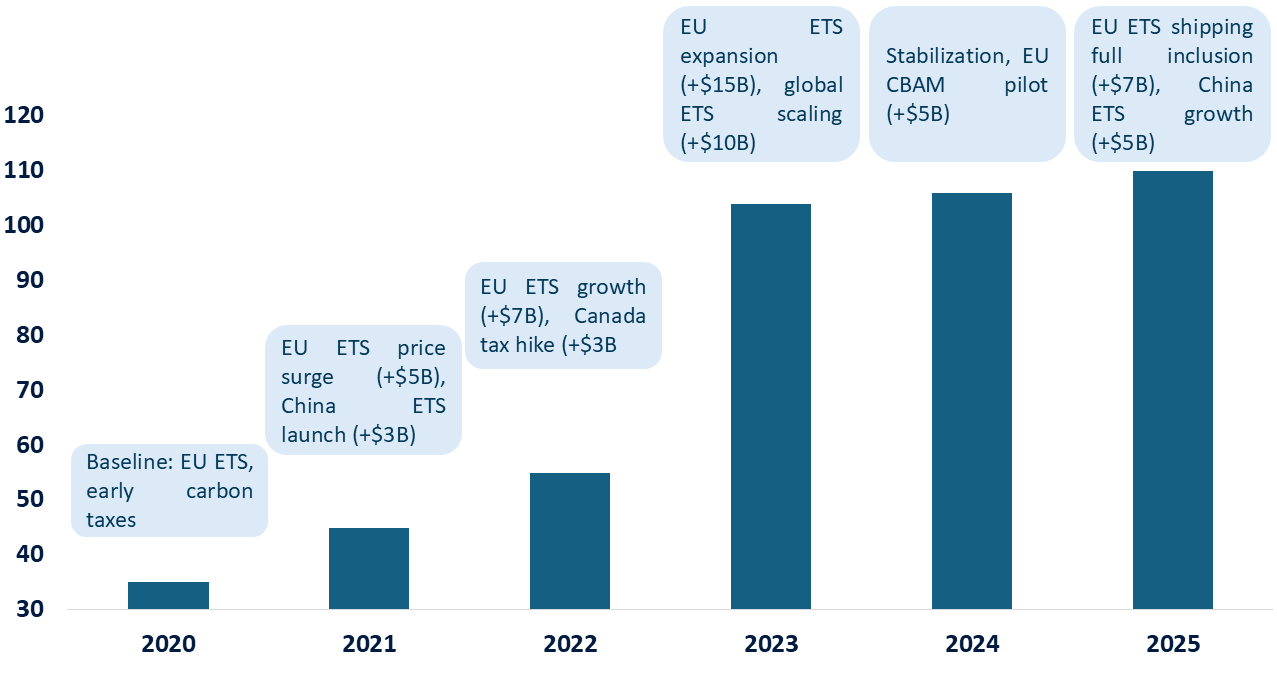
The graph below visualizes projected global carbon pricing revenues (ETS + taxes), underscoring the fiscal firepower for reinvestment in credits and subsidies.

Global Carbon Pricing Revenues (2020-2025, USD Billion)
Assumptions: 5-10% annual growth, 28% emissions coverage. This trajectory highlights $110 billion in 2025 revenues, with 55%+ allocated to green initiatives – fueling credits that could offset 12 billion tCO₂e globally.
Risks and Opportunities: Navigating the Green Fiscal Maze
Opportunities abound: Subsidies like Germany’s automotive grants reduce lifecycle GHG emissions by 50% for EVs, while India’s GST cuts enable 15% cost savings on imports. Carbon credits offer arbitrage—firms in high-price markets (Uruguay at $160/tCO₂) can sell to low-price buyers, generating $250B market value by 2050.
Yet risks persist: U.S. OBBBA scales back IRA credits post-2025, potentially hiking costs 10-15% for non-compliant projects; EU CBAM imposes €0.22/kg on imports, risking supply chain disruptions. Polluting incentives still comprise 9.5% of global CIT tools, diluting impact. For SMEs, upfront verification costs for credits can reach $50K, underscoring the need for bundled consulting.
Strategic Roadmap: Maximizing Green Incentives
Our proprietary Assess-Align-Activate framework empowers clients to capture value:
- Assess Eligibility: Audit operations against thresholds e.g., U.S. IRA’s 1MW wage rules or EU’s GBER exemptions. A mid-sized manufacturer might qualify for $5M in Canadian hydrogen credits.
- Align Portfolios: Integrate credits into ESG strategies – pair U.S. 45Q ($85/tCO₂) with voluntary offsets for 20% emission reductions. Model scenarios: A €10M solar project yields €3M ITC plus €500K credits.
- Activate and Monetize: Leverage transferability (e.g., IRA direct pay for tax-exempts) and blockchain for credit tracking, cutting admin by 30%. Partner with aggregators for scale; one client monetized 1MtCO₂e credits for €15M.
- Monitor and Adapt: Track evolutions like China’s ETS expansion (40% coverage) via dashboards; annual reviews ensure 10-15% uplift from policy shifts.
Non-leverage risks 20% higher capex; adopters report 18% EBITDA gains.
Conclusion: Green Incentives as Growth Catalysts
In 2025, green tax incentives transcend compliance – they’re blueprints for prosperity, channeling $110 billion in revenues toward a $50 trillion ESG asset class by year-end. By mastering carbon credits and subsidies, firms can decarbonize profitably, outpacing peers in a USD 300 billion clean tech market.
RNG STRATEGY CONSULTING has delivered 25% average savings for clients navigating this ecosystem – let’s audit your opportunities today.


